TDC: Determination of Moments from Doppler Spectra
![]()
![]()
![]()
![]()
![]()
From the thousands of transmitted pulses of energy, the profiler records one Doppler spectrum for each range resolution volume. These spectra are recorded and archived for future calculations.
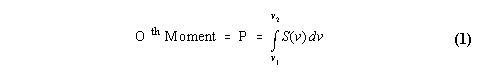
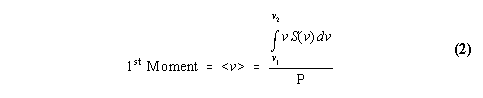
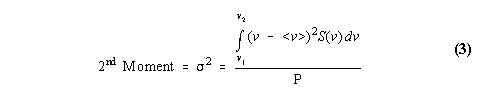
The spectra can be described by the first three moments. The following sections describe how the moments are determined from the original Doppler velocity spectrum and how the moments are converted to reflectivity factor, mean Doppler velocity, and spectral width.
Spectral Moment Determination and Quality Control.
From the recorded Doppler velocity spectrum the first three moments are determined and correspond to the signal power, reflectivity weighted Doppler velocity, and spectrum variance using the relations:
In order to obtain calibrated profiles, the signal power from the zeroth moment is converted to signal-to-noise ratio defined by
The signal-to-noise ratio is used in the calculations below.
The moments are integral equations using the starting and ending velocities: v1, and v2. It is possible to use the whole Doppler velocity spectrum (from v1 = -VNyquist, and v2 = +VNyquist) in the moment calculations, but these calculations are subject to bias due to multiple peaks and noise in the spectra. An automated procedure developed at the NOAA Aeronomy Laboratory to separate multiple peaks in the spectral is used to isolate the largest amplitude peak from smaller peaks. In brief, the automated procedure selects the largest spectral peak and follows the spectrum down to the noise floor or until the spectrum increases in magnitude consistent with another spectral peak. This procedure is separating the Bragg scattering return caused by turbulence from clear-air motions from the Rayleigh scattering return from hard distributed targets.
This automated procedure is a single peak picking method with an intelligent neighboring peak separator. By stopping at the valley between neighboring peaks, this peak picking method is not as biased as naive moment estimators that do not separate different spectral peaks. The limitation with this method is that the largest magnitude peak is selected regardless of the selected peaks at neighboring spectra both in altitude and in time. This method can not provide both the Bragg and Rayleigh components of the spectra. Only the moments from the largest magnitude peak are retained. The NOAA Aeronomy Laboratory is developing multi-peak peaking methods that enable the separation of the Bragg and Rayleigh scattering components in the Doppler Spectra.
Delete observations below the Threshold of Detectability.
The empirically derived Threshold of Detectability determines the minimum signal-to-noise ratio for atmospheric observations. All observations below this threshold are not considered to result from atmospheric scattering processes. The Threshold of Detectability is range independent. The Threshold of Detectability, threshold, in log units is defined as:
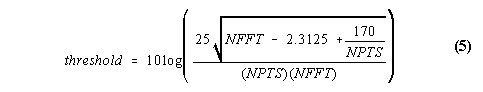
where NFFT is the number of FFTs averaged to produce the final spectra, and NPTS is the number of points in the spectra. If an observed spectra has a signal-to-noise ratio less than the Threshold of Detectability, the output file will contain the 'bad data' variable.
For each profile, correct the signal-to-noise ratio for enhanced noise.
For Doppler spectra that span a large fraction of the Nyquist velocity range, there may not be enough spectral points to accurately represent the true noise level. For these broad Doppler spectra, the calculated noise may overestimate the true noise. Thus, the signal-to-noise ratio may be too low, and the subsequent equivalent reflectivity factor may also be too low.
The goal is to replace the elevated noise values with a good estimate of the noise. Since the noise is range independent, the noise at the 10 highest range gates (where the spectra are not broad) are averaged to form an estimate of the true noise for that profile. The noise at each range is adjusted to produce an adjusted signal-to-noise ratio. This adjusted signal-to-noise ratio is used to calculate the equivalent reflectivity factor.
The mean noise at the 10 highest range gates is expressed
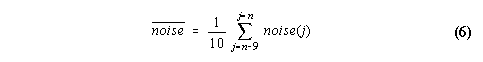
where noise(j) is the noise in linear units at the jth range gate and there is a total of n range gates. The noise and mean noise can be converted to log units using
![]()
![]()
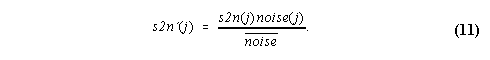
The signal-to-noise ratio, s2n(j), can be expressed in log units by
![]()
where s2n(j) is in linear units expressed for each range gate. The adjusted signal-to-noise ratio, s2n'log, is calculated in log space using
![]()
The adjusted signal-to-noise ratio is calculated in linear space using
Calculate the equivalent reflectivity factor from the adjusted signal-to-noise ratio.
The liquid water equivalent reflectivity factor is determined from the adjusted signal-to-noise ratio and the range gate distance by
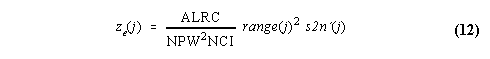
where ALRC is the Aeronomy Laboratory Radar Constant, NPW is the pulse width in nanoseconds, NCI is the number of coherent integrations, range(j) is the range gate distance in meters, and s2n'(j) is the adjusted signal-to-noise ratio expressed in linear units. The units of the ALRC are defined such that the units of ze(j) are mm6 m-3. Typically, ALRC is a constant for a particular installation. The equivalent reflectivity factor can be expressed in log units by
![]()
and has units of dBZe. All calculations are in reference to liquid water equivalent reflectivity factor. The minimum detectable reflectivity factor is defined using (8) and setting s2n'(j) to the Threshold of Detectability.
Adjust the equivalent reflectivity by the Time Domain Averaging filter (TDA filter).
Coherent integration is a digital filtering process used by profilers. Coherent integration does not increase the signal-to-noise per unit bandwidth in the signal band, but it simply filters out much of the wideband noise. This digital filter is called the Time Domain Averaging filter (TDA filter). One side effect of using coherent integration is the decreased power return at frequencies different than zero Doppler shift. This decreased power follows the sinc function with a power response of unity at zero Doppler velocity and the first null located at +/- 2 vNyquist velocities. The power response for the TDA filter is expressed
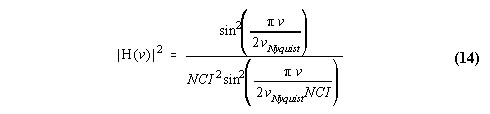
where v is the velocity in ms-1, and vNyquist is the Nyquist velocity in ms-1 defined by
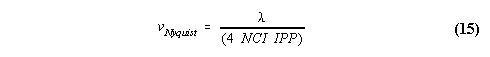
where ![]() is the operating wavelength, and IPP is the inter-pulse period.
is the operating wavelength, and IPP is the inter-pulse period.
The calculated equivalent reflectivity factor can be corrected by the inverse of the TDA transfer function and is expressed
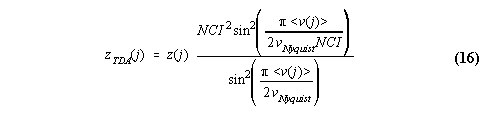
where z(j) is the reflectivity at the jth range gate, and <v(j)> is the reflectivity-weighted mean Doppler velocity at the jth range gate. For simplicity, the subscript "TDA" will be omitted in all references to the equivalent reflectivity factor, even though the correction has been applied.
Define Doppler velocity such that downward motion is negative.
The Doppler velocity recorded by the profiler is defined as positive motion toward the radar. The sign of the mean reflectivity-weighted Doppler velocity is inverted in the precipitation data products to be consistent with the meteorological convention of downward motion having a negative value.
Define Spectral Width as twice the spectrum standard deviation
The spectrum variance is defined as the second moment
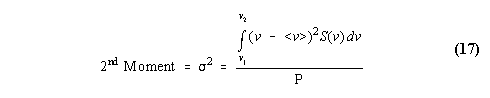
The spectral width is defined as twice the spectrum standard deviation and is expressed
![]()