NOAA Logo
Physical Sciences Laboratory
  • About
      • About Us
      • Organization At-A-Glance
      • Science Reviews
      • DEIA
      • Visiting NOAA Boulder
  • People
    • Contact Us
    • Staff List
    • Employee Spotlight
  • Research
      • Research
      • Overview
      • Teams
      • Publications
      • Assessments
      • Selected Topics
      • 20th Century Reanalysis
      • Atmospheric Rivers
      • El Niño and La Niña
      • Renewable Energy
      • Interpreting Climate Conditions
      • Marine Heatwaves
      • In the Field
      • AQPI
      • ATOMIC
      • ENRR
      • MOSAiC
      • SPLASH
      • Observations
      • Arctic Climate
      • Shipboard
      • Technology
  • Data
    • All
    • Gridded Climate
    • Profiler Network Data & Image Library
    • Research Cruises
    • Arctic
    • Satellite
    • Boulder Climate & Weather
    • Plotting & Analysis Tools
    • Help
  • Products
    • All
    • Experimental
    • Map Room
    • Plotting & Analysis Tools
    • Subseasonal Tropical Forecasts
    • Climate Change Web Portal
    • 20th Century Reanalysis
    • FACTS
    • WRIT
  • News | Events
    • News
    • Events
    • Seminars
  • Learn
    • Research Handouts
    • Education Resources
    • Funtastic Science Talks
PSL Climate Data Repository
  • PSL Climate Data Repository
  • Public
  • Interpreting Climate Conditions - Case Studies
  • Colorado Heat - June 2012
  • images
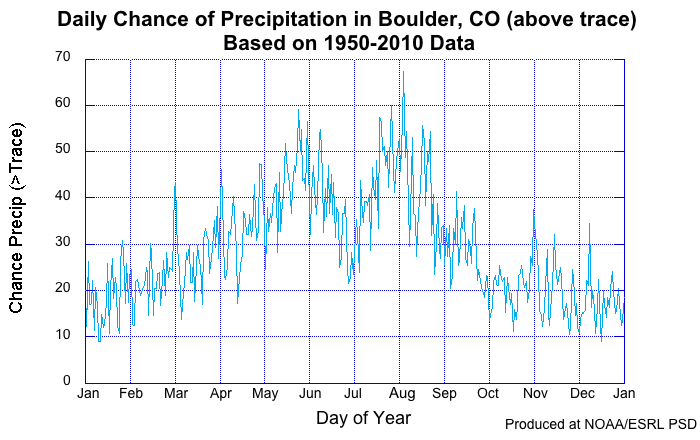
Boulder Chance of Precipitation
  • Information
  • Connections
URL: http://www.psl.noaa.gov/boulder/images/chance.precip.boulder.png
 From  Type   To
Colorado Story   wikilink   Boulder Chance of Precipitation
Colorado Story   wikilink    ... 

Related
Station Time Series Plots
March-June 2012 Standardized Precipitation Anomaly
June 2012 Surface Temperature Anomaly
Boulder Max/Min/Avg Temperature
Mar-June 2012 Precipitation Anomaly
June 2012 Surface Temperature Departure
May-June 2012 500 hPa heights
May-June 1956 500 hPa heights
March-June 1956 Standardized Precipitation Anomaly
June 1956 Surface Temperature Departure
Southwest U.S. CMIP5 vs. Observed
Southwest U.S. AMIP vs. Observed
6 month precipitation departure from normal Colorado
Two-year precipitation departure from normal
Colorado June Minimum Temperature Trend 1901-2010
Colorado June Maximum Temperature Trend 1901-2010
Observed Temperature/Precipitation Trends - 1901-2010
Colorado Story

Mailing Address

NOAA PSL
325 Broadway
Boulder, CO 80305-3328

Connect with ESRL


Physical Sciences Laboratory

About

Contact Us

Site Index

Take Our Survey

Webmaster

More

Privacy Policy

Disclaimer

Accessibility

USA.gov

DOC  |  NOAA  |  OAR  |  ESRL