20th Century Reanalysis V2
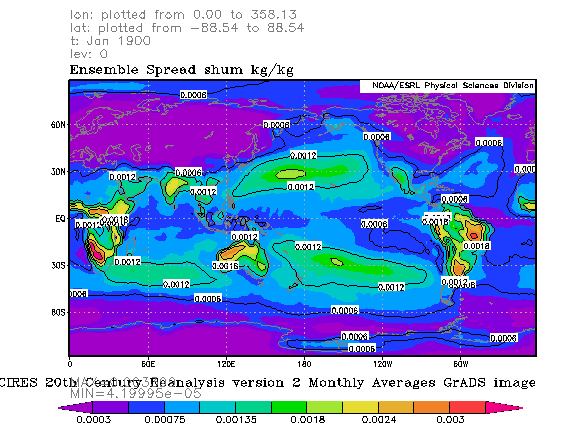
This plot shows the average month spread of 2m specific humidity for Jan 1900.
Options to produce plot are using the PSL Search and Plot
- Dataset: NOAA-CIRES 20th Century Reanalysis Version 2 Monthly Averages
- Specific Humidity
- Select: Monthly Ensemble Spread 2m Specific humidity 'make plot or subset'
- Begin/End Jan 1900
- Plot on white background
- Fill/Shade