Monthly Climate Timeseries:
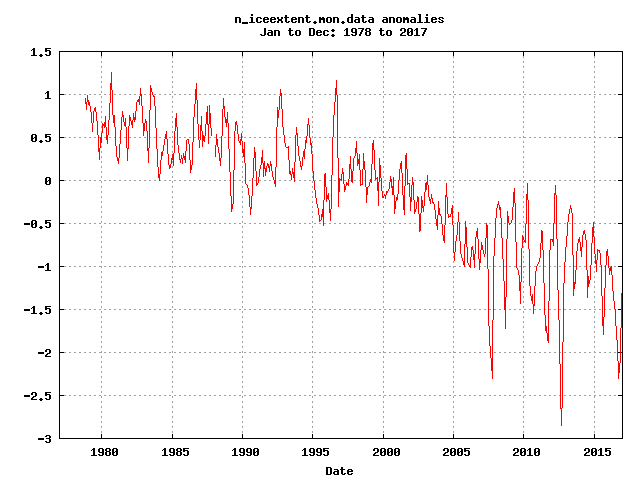
Northern Hemisphere Sea ice extent/area
- Description:
-
From the NSIDC website
"The Sea Ice Index provides a quick look at Arctic- and Antarctic-wide changes in sea ice. It is a source for consistent, up-to-date sea ice extent and concentration images, in PNG format, and data values, in ASCII text files, from November 1978 to the present. Sea Ice Index images also depict trends and anomalies in ice cover calculated using a 30-year reference period of 1981 through 2010.
The images and data are produced in a consistent way that makes the Index time-series appropriate for use when looking at long-term trends in sea ice cover. Both monthly and daily products are available. However, monthly products are better to use for long-term trend analysis because errors in the daily product tend to be averaged out in the monthly product and because day-to-day variations are often the result of short-term weather."
- Image:
- Timeseries Plot:
- Select this link to get a plot. Plot is taken from the Timesseries Plotting and Analysis webpage.
- Calculation Method:
-
See NSIDC webpage. Note that the spatial coverage is:
Sensors used in dataset are: SMMR, SSM/I, SSMIS. Please see the User Guide for more information.
N: 90, S: 30.98, E: 180, W: -180
- Time Interval: Monthly
- Time Coverage: Nov 1978 - present
- Update Status: Monthly
- Get Data:
- Update Status: Monthly
-
NH Sea-ice extent.: Standard PSL Format (What is standard format?)
-
NH Sea-ice area.: Standard PSL Format (What is standard format?)
- Source:
- Data is from the NSIDC: Dataset G02135: Sea Ice Index, Version 3
- Related Time-series:
- References:
-
- Fetterer, F., K. Knowles, W. Meier, M. Savoie, and A. K. Windnagel. 2017, updated daily. Sea Ice Index, Version 3.
- Citation:
- Cite as: Fetterer, F., K. Knowles, W. Meier, M. Savoie, and A. K. Windnagel. 2017, updated daily. Sea Ice Index, Version 3. [Indicate subset used]. Boulder, Colorado USA. NSIDC: National Snow and Ice Data Center. doi: http://dx.doi.org/10.7265/N5K072F8. Accessed version at NOAA/ESRL PSL on [Date Accessed].