Ocean WRIT Mapping Page: Plot Example
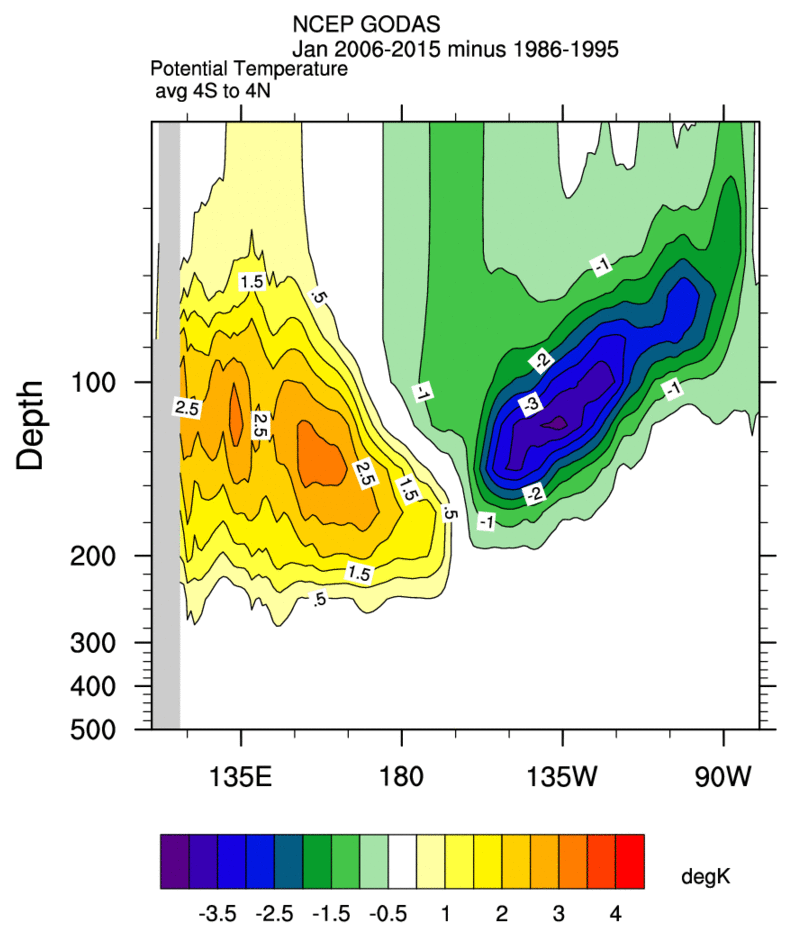
Plot of NCEP/GODAS Potential Temperature from 0-500m for the decade 2006-2015 minus the decade 1986-1995 over the tropical Pacific equatorial region
 (click for large image)
Options for the Ocean WRIT Monthly Mapping page.
|  |