Physical Sciences Laboratory
Toggle navigation
About
About Us
Organization At-A-Glance
Research Divisions
Science Reviews
DEIA
Visiting NOAA Boulder
People
Contact Us
Staff List
Employee Spotlight
Research
Research
Overview
Research Divisions
Publications
Assessments
Selected Topics
20th Century Reanalysis
Atmospheric River Portal
El Niño and La Niña
Renewable Energy
Interpreting Climate Conditions
Marine Heatwaves
In the Field
AQPI
ATOMIC
ENRR
MOSAiC
SPLASH
Observations
Arctic Climate
Shipboard
Technology
Data
All
Gridded Climate
Profiler Network Data & Image Library
Research Cruises
Arctic
Satellite
Boulder Climate & Weather
Plotting & Analysis Tools
Help
Products
All
Experimental
Map Room
Plotting & Analysis Tools
Subseasonal Tropical Forecasts
Climate Change Web Portal
20th Century Reanalysis
FACTS
WRIT
News | Events
News
Events
Seminars
Learn
Research Handouts
Education Resources
Funtastic Science Talks
Home
WRIT
WRIT example
Ocean WRIT Mapping Page: Plot Example
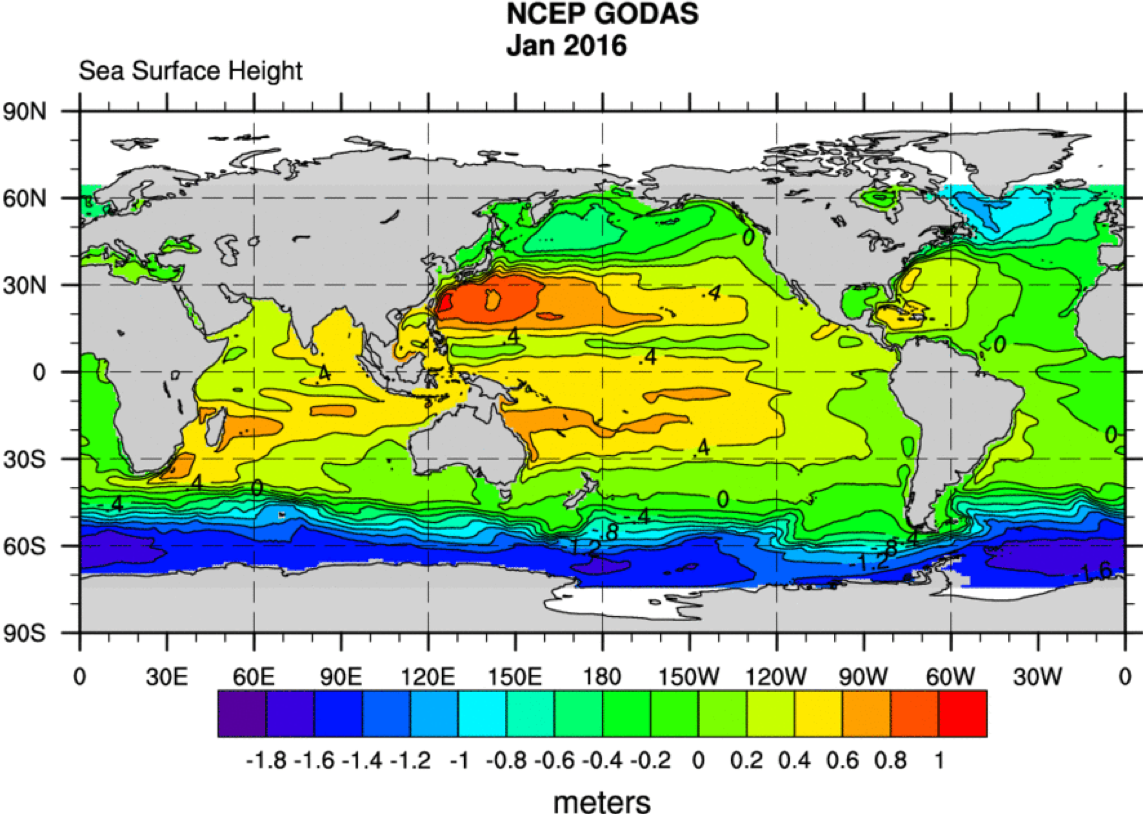
Map of NCEP/GODAS Sea Surface Height (SSH) for Jan 1983 over the globe
(click for large image)
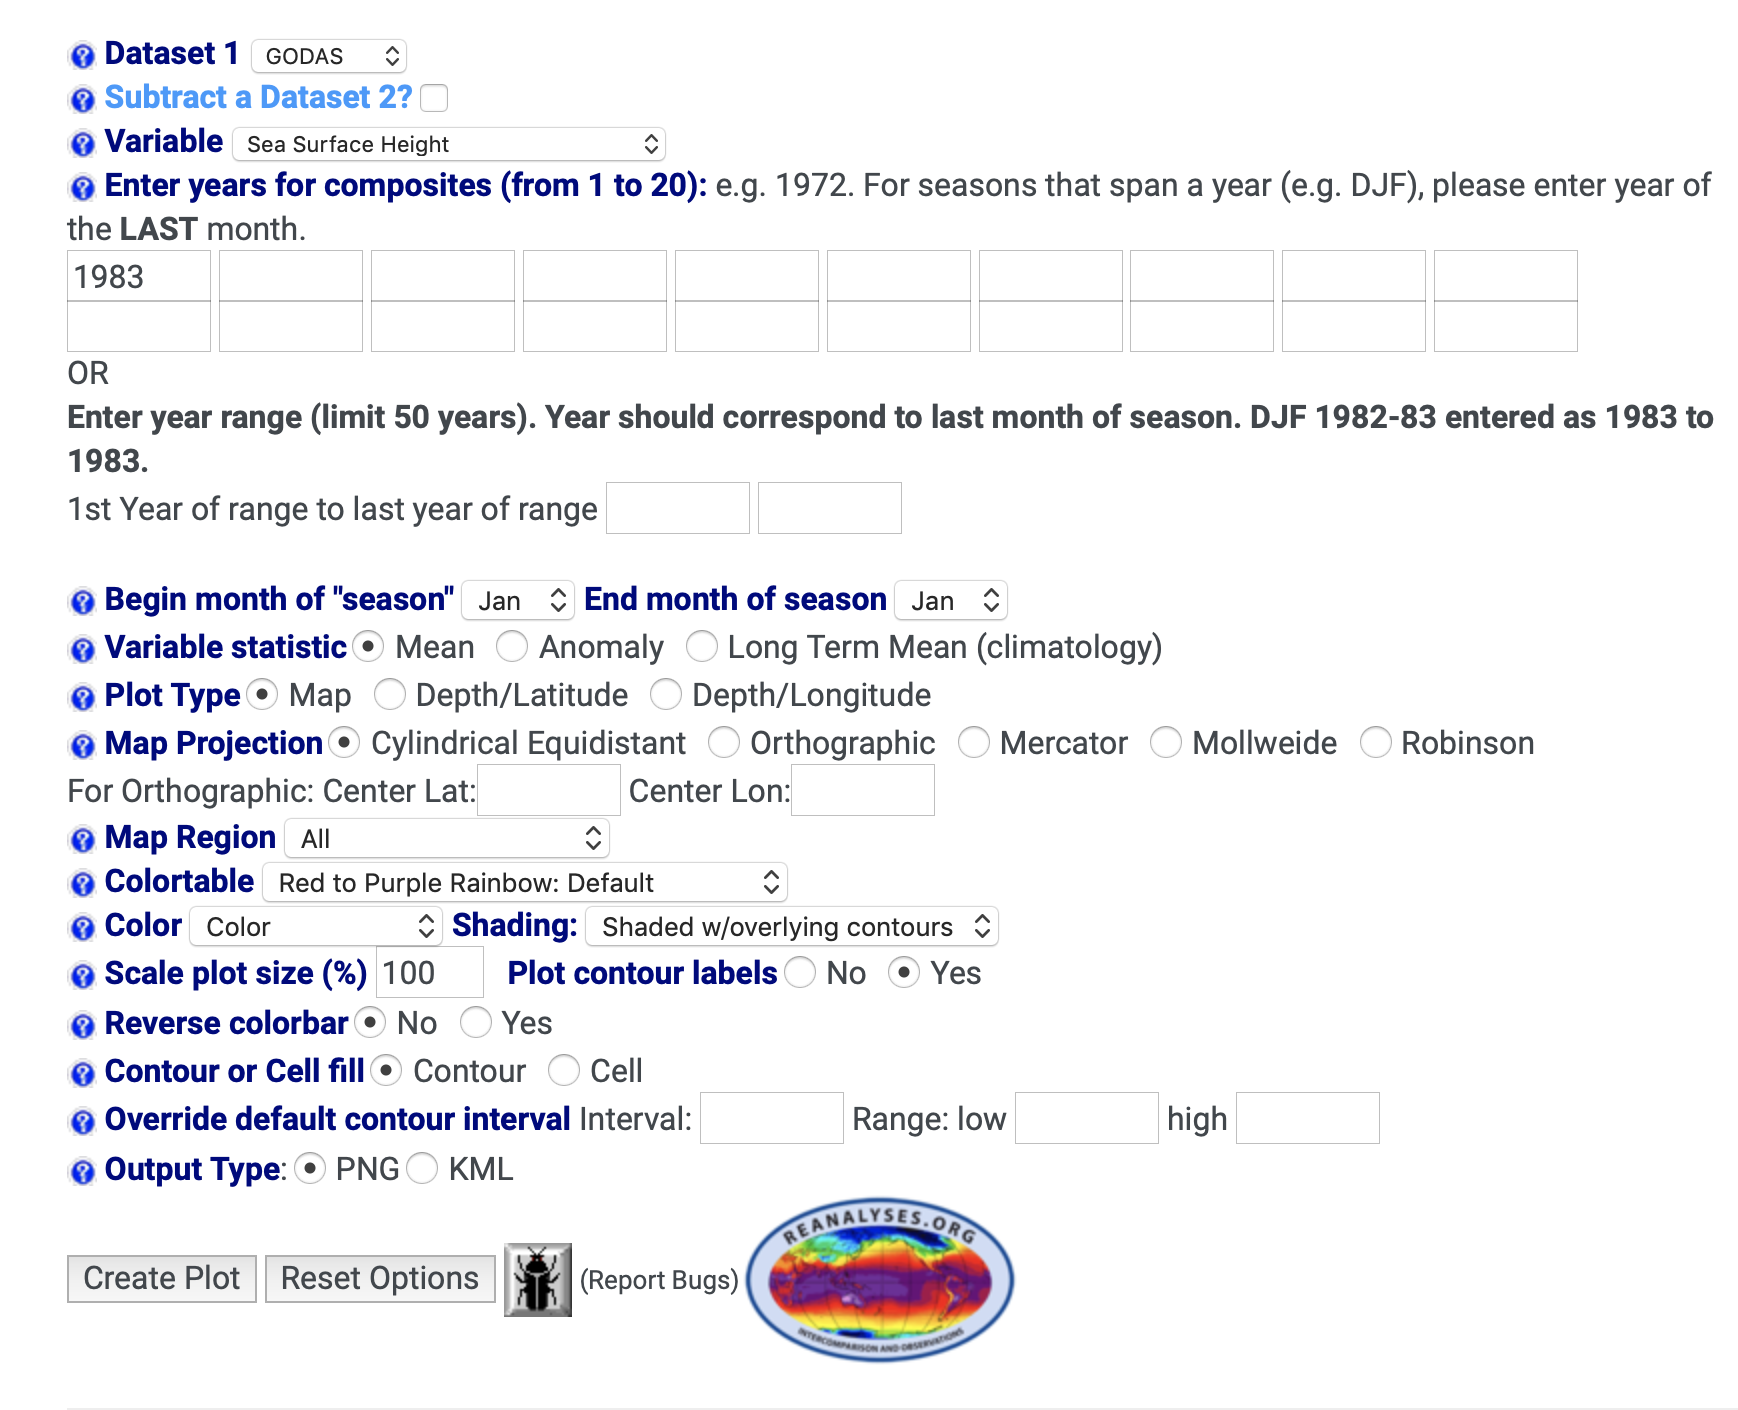
Options for the
Ocean WRIT Monthly Mapping page
.
Plotting page with filled in options
Variable:
SSH
Dataset 1:
NCEP GODAS
Beginning month of season:
Jan
End month of season:
Jan
Years:
1983
Plot Type:
Map
Statistic:
Mean
Map Region:
All
Ocean WRIT Tools
WRIT Home
Mapping
(
Directions
)
Time-series
(
Directions
)
Correlation
(
Directions
)
Profiles
(
Directions
)
Ocean WRIT Details
Datasets
Index Time-series
Caveats
WRIT Background
Reanalyses.org
Referencing Plots
BAMS WRIT article
Related Plot/Analysis Tools
Extract Monthly Time-Series
All PSL interactive web tools