Ocean WRIT: Time-series: Example plot
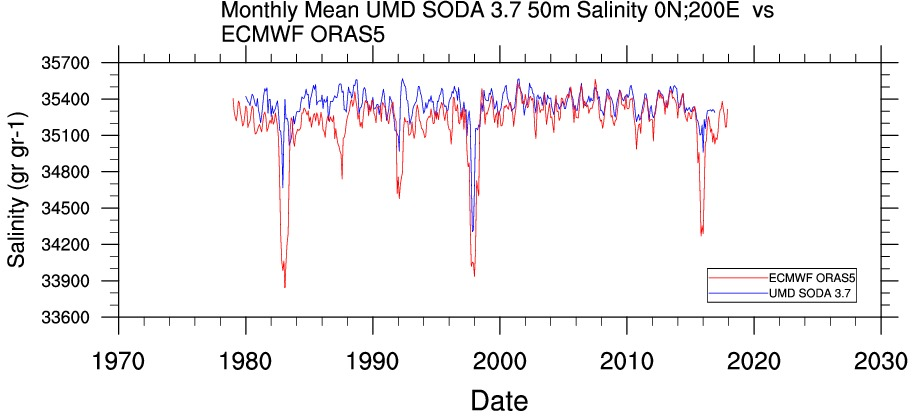
This plot compares two time-series of monthly mean salinity at 50m: SODA3 vs ORAS5 at 0N; 200E (160W).
Options to change from from defaults to produce plot are using the Ocean WRIT Timeseries Plotting page
|
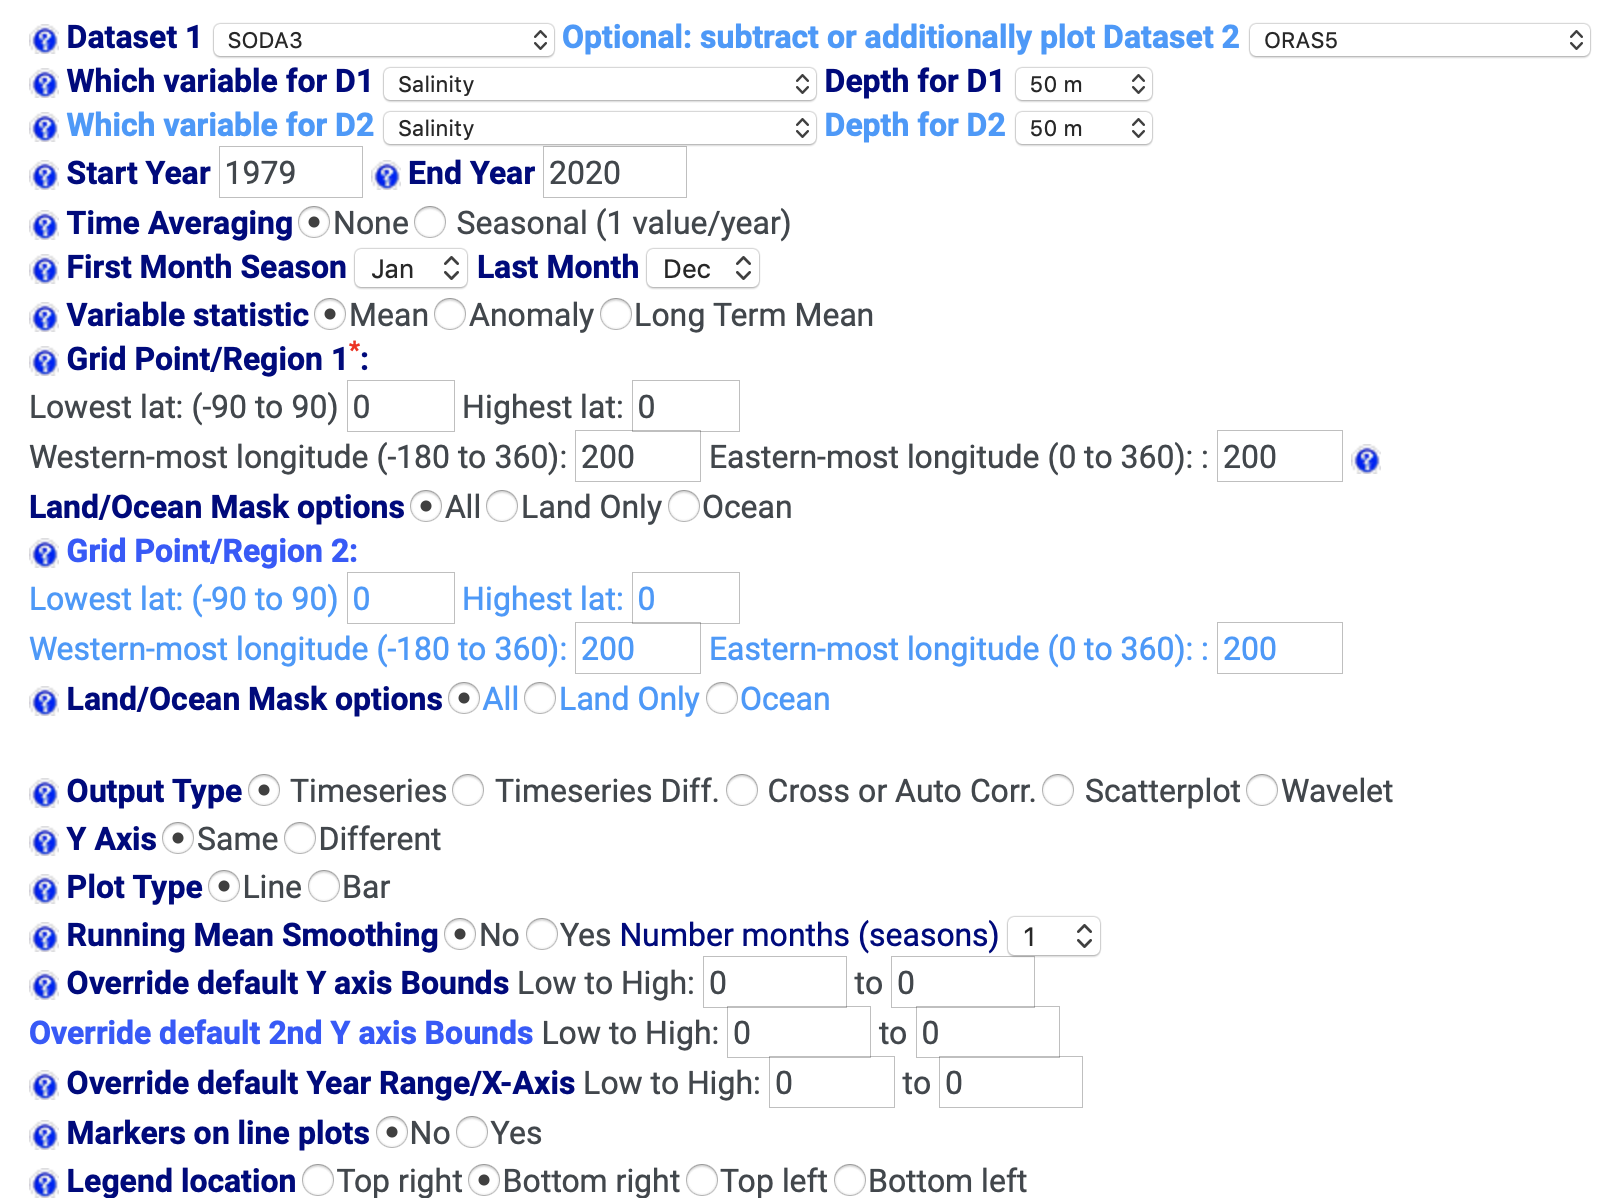 |
Options to change from from defaults to produce plot are using the Ocean WRIT Timeseries Plotting page
|
|