WRIT Ocean Correlation Page: Plot Example
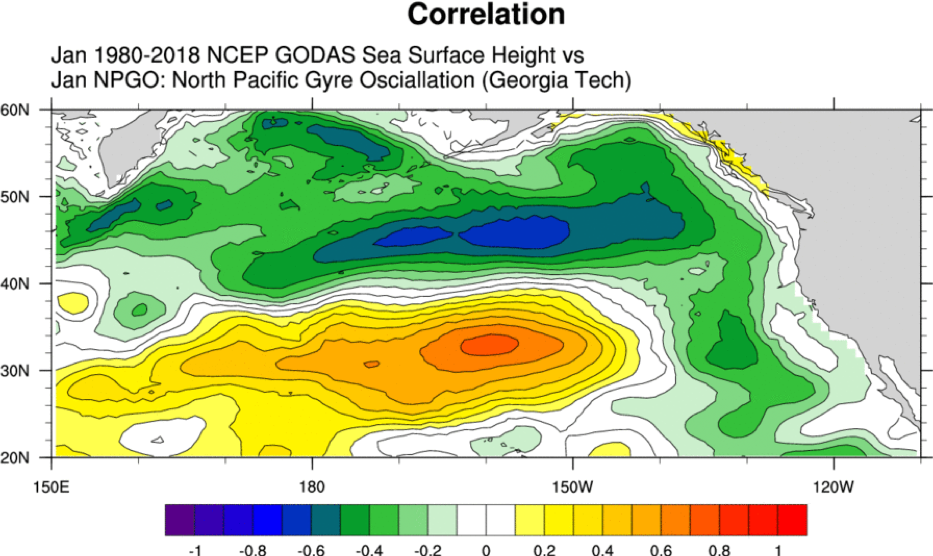
This plot shows the correlation of the North Pacific Gyre Oscillation Index and NCEP GODAS Sea Surface Height (SSH)
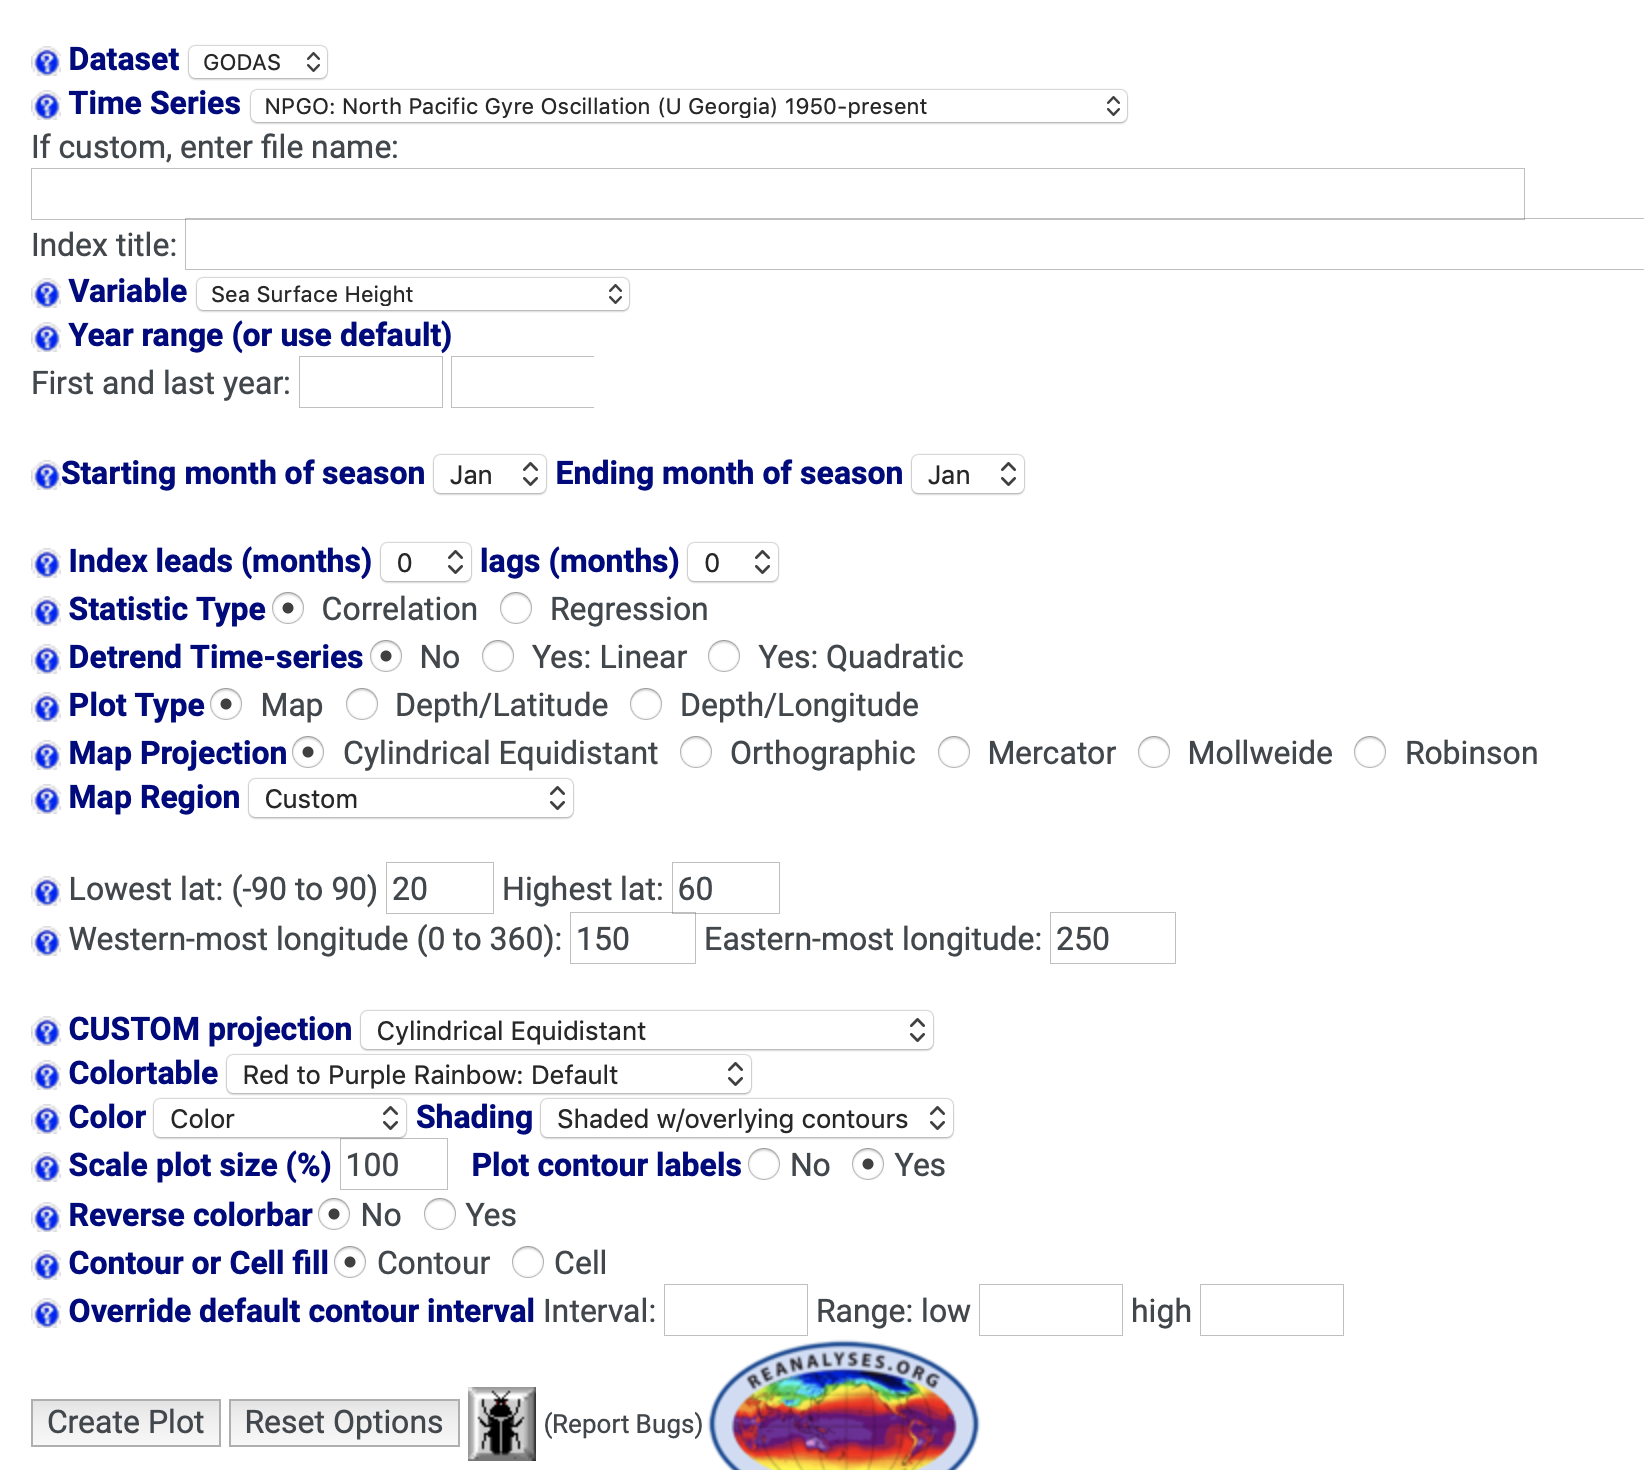
Options to produce plot are using the Ocean WRIT Monthly Correlation Page
Filled in Analysis/Plotting Options
|
 |