Web-based Reanalyses Intercomparison Tools (WRIT)
Atmosphere
Ocean
Product Descriptions
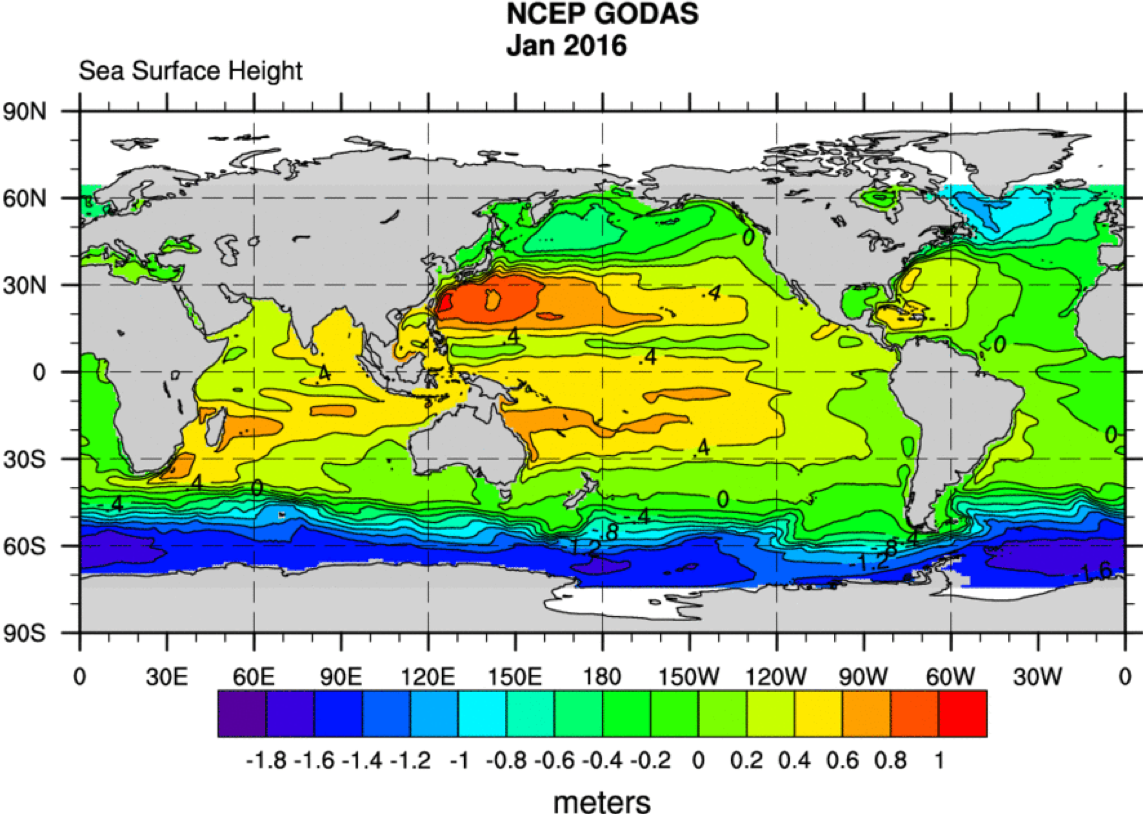
Atmospheric or Oceanic Monthly/Seasonal Plotting Page:
Allows users to make maps and vertical
cross-sections from various reanalyses. Statistics include means, anomalies and climatologies.
Users can also difference the various reanalyses for all three types of statistics (for any
overlapping date in the reanalyses). Composites (averaging multiple dates) are also available.
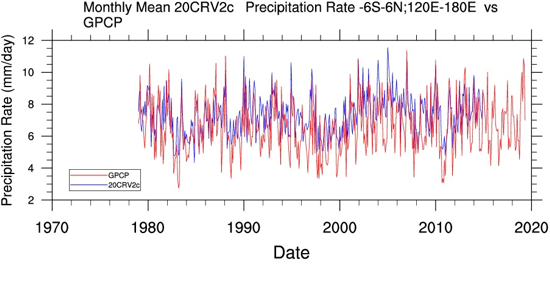
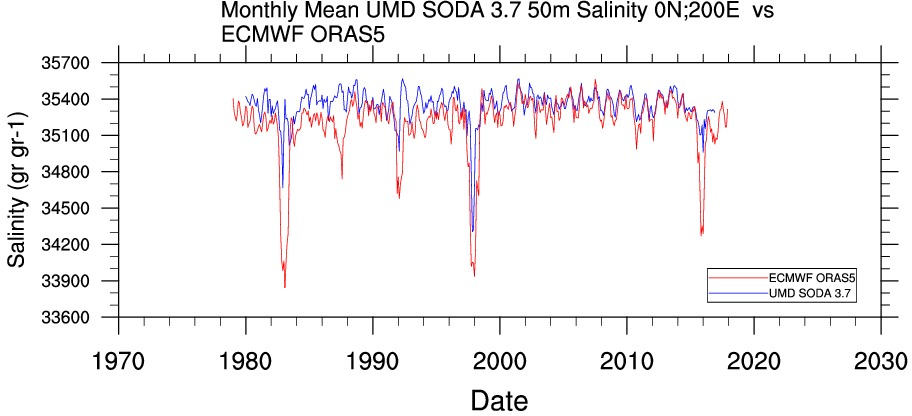
Atmospheric or Oceanic Monthly Timeseries Extractor/Analyzer:
Extracts timeseries at specified lat/lon
or lat/lon ranges and either plots the time-series, time-series differences, and scatter plots.
Various statistics are returned in addition to numeric values of the time-series plotted.
Ability to plot and compare climate index time-series such as
the PNA or Niño3.4 or upload your own.
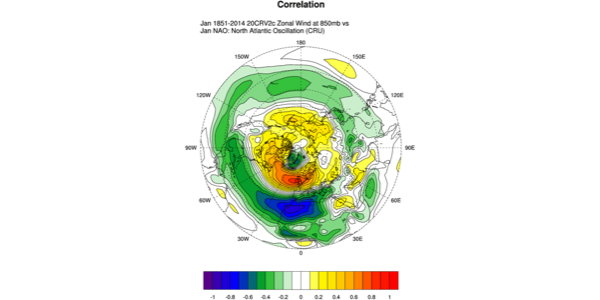
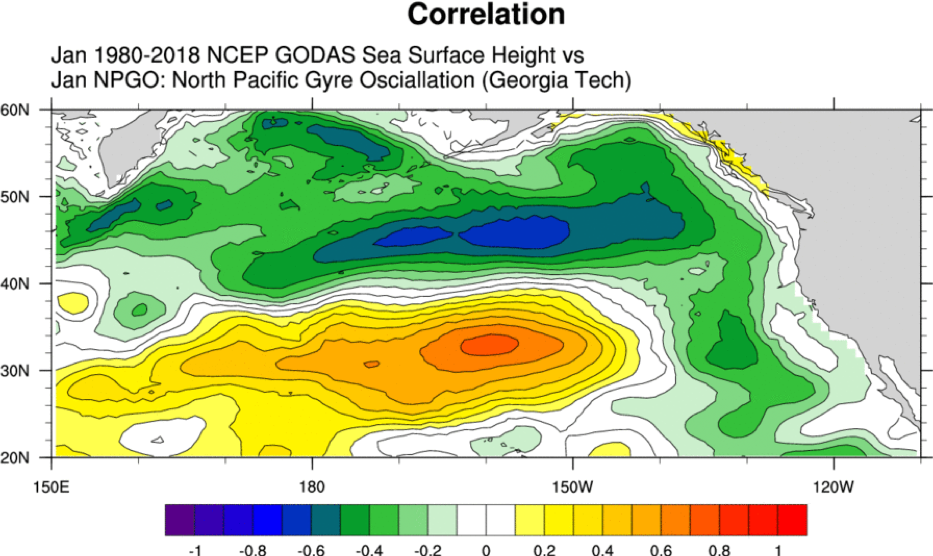
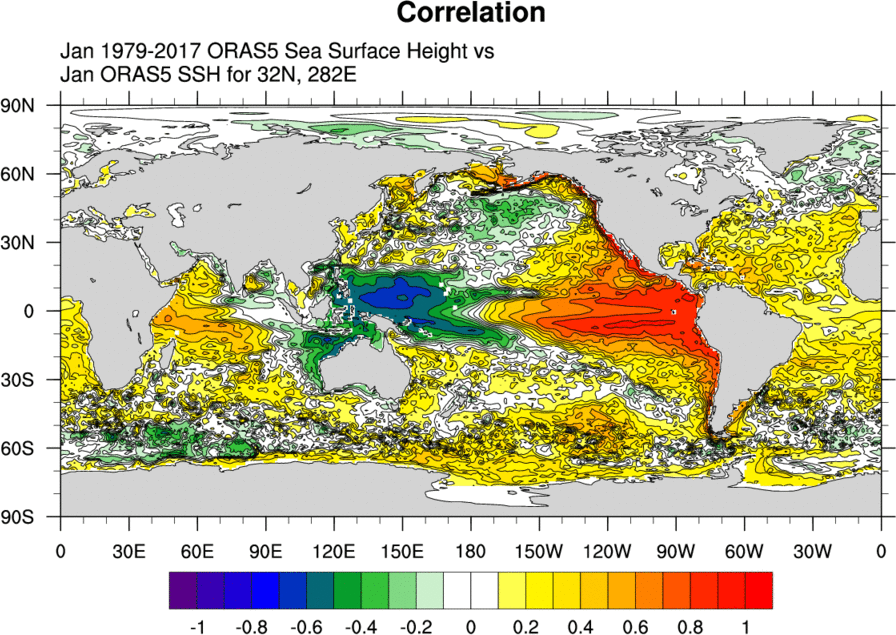
Atmospheric or Oceanic Monthly Correlation Plotter:
Calculates correlations (and regressions) of the
reanalysis and observational dataset with supplied atmospheric/ocean indices or user uploaded
time-series. Users can plot correlations at different lead/lags. They can also create vertical
cross-section correlation plots.
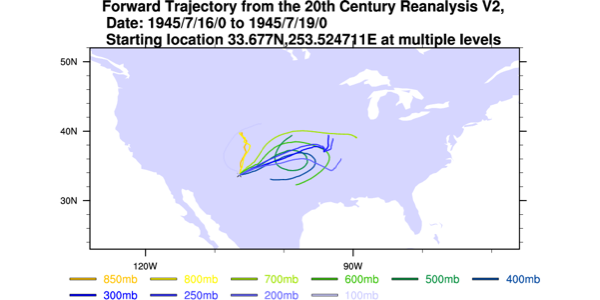
Atmospheric Trajectory Generator:
Allows users to plot forward and backward air
trajectories from different reanalyses (currently NCEP R1, NCEP R2, and 20CR, and ERA-Interim).
Users can plot the trajectories of one or more levels on a single plot. The output is plotted on
a map and is available as netCDF and as KMZ files suitable for Google Earth.
Atmospheric Distribution Analyzer:
Allows users to plot and compare the distributions of
daily data during a season from different sources including different reanalyses (currently
NCEP R1 and 20CR) and observed data. Users can see where data values have fallen historically
and can see how different distribution assumptions impact the tails of the distribution.
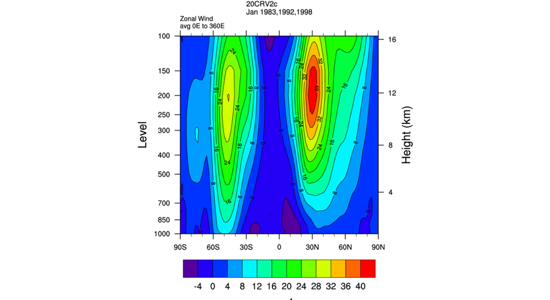
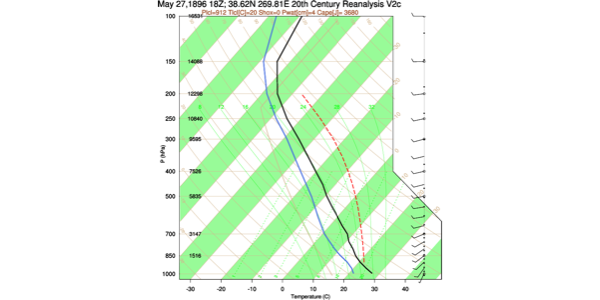
Atmospheric Vertical Profiles:
Allows users to plot different vertical products from
reanalyses including skew-T, variable/height, timeXheight, and vertical transects (daily data).
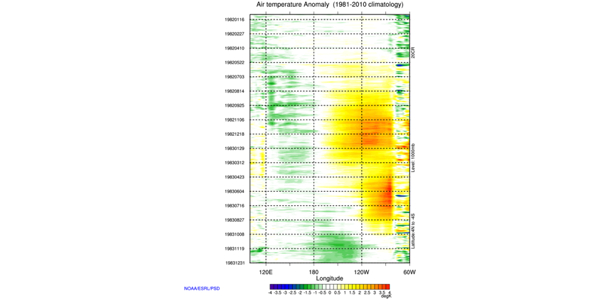
Atmospheric Hovmollers:
Allows users to make plots of daily and subdaily time by latitude or time by longitude for different reanalysis datasets. Statistics include means and anomalies.
Posters/Talks
- Ocean WRIT: preliminary PPT
Publication
- Smith C. A., G. P. Compo and D. K. Hooper (November 2014): Web-Based Reanalysis Intercomparison Tools (WRIT) for Analysis and Comparison of Reanalyses and Other Datasets. Bull. Am. Meteorol. Soc., 95 (11), 1671-1678. doi:10.1175/BAMS-D-13-00192.1
Future WRIT Tool Enhancements
- Standardized time-series
- Lead/Lag time-series relationships
- Spatial correlations comparing different reanalyses
Future Atmospheric WRIT Products
We are exploring the feasibility of various tools. The features we hope to have are:
- Daily time scale composites atmospheric reanalyses.
- Sub-Daily composite atmospheric reanalyses
- Creation and comparison of index timeseries such as the PNA from the various atmospheric reanalyses
Future Ocean WRIT Products
- Comparison of buoy and profile data
Background
- Reanalyses.org: A wiki for advancing reanalyses. Users can find information about reanalyses (atmosphere, ocean, land), how to access and plot data, reanalyses observations, diagnostics, and more. Members can post information and ask questions of the reanalysis community.
- Caveats. Also see specific tool information.
- Smith C. A., G. P. Compo and D. K. Hooper (November 2014): Web-Based Reanalysis Intercomparison Tools (WRIT) for Analysis and Comparison of Reanalyses and Other Datasets. Bull. Am. Meteorol. Soc., 95 (11), 1671-1678. doi:10.1175/BAMS-D-13-00192.1
Datasets
There are two types of gridded datasets in the PSL WRIT tools pages. They are atmosphere and ocean reanalysis and gridded observations/analysis. Each web tool uses different sets of datasets depending on what it is plotting/analyzing, our storage, server, and memory resources. Thereis a link from each page to the datasets used. There are also climate and ocean time-series available for the correlation webpage and the time-series plotting pages. See- List of index time-series (PNA, ENSO, NP,...)
Atmospheric WRIT Examples